FREE INDICATORS
This article provides a list of free Aura Trade indicators with explanations

Our free indicators are analytical algorithms, the data of which are of introductory nature and help in independent analysis
How to add indicators?
Click on the link under the desired version (links under the names)
Wait a few seconds, refresh the page if you are using the web version, or restart the app
Step 1
Step 2
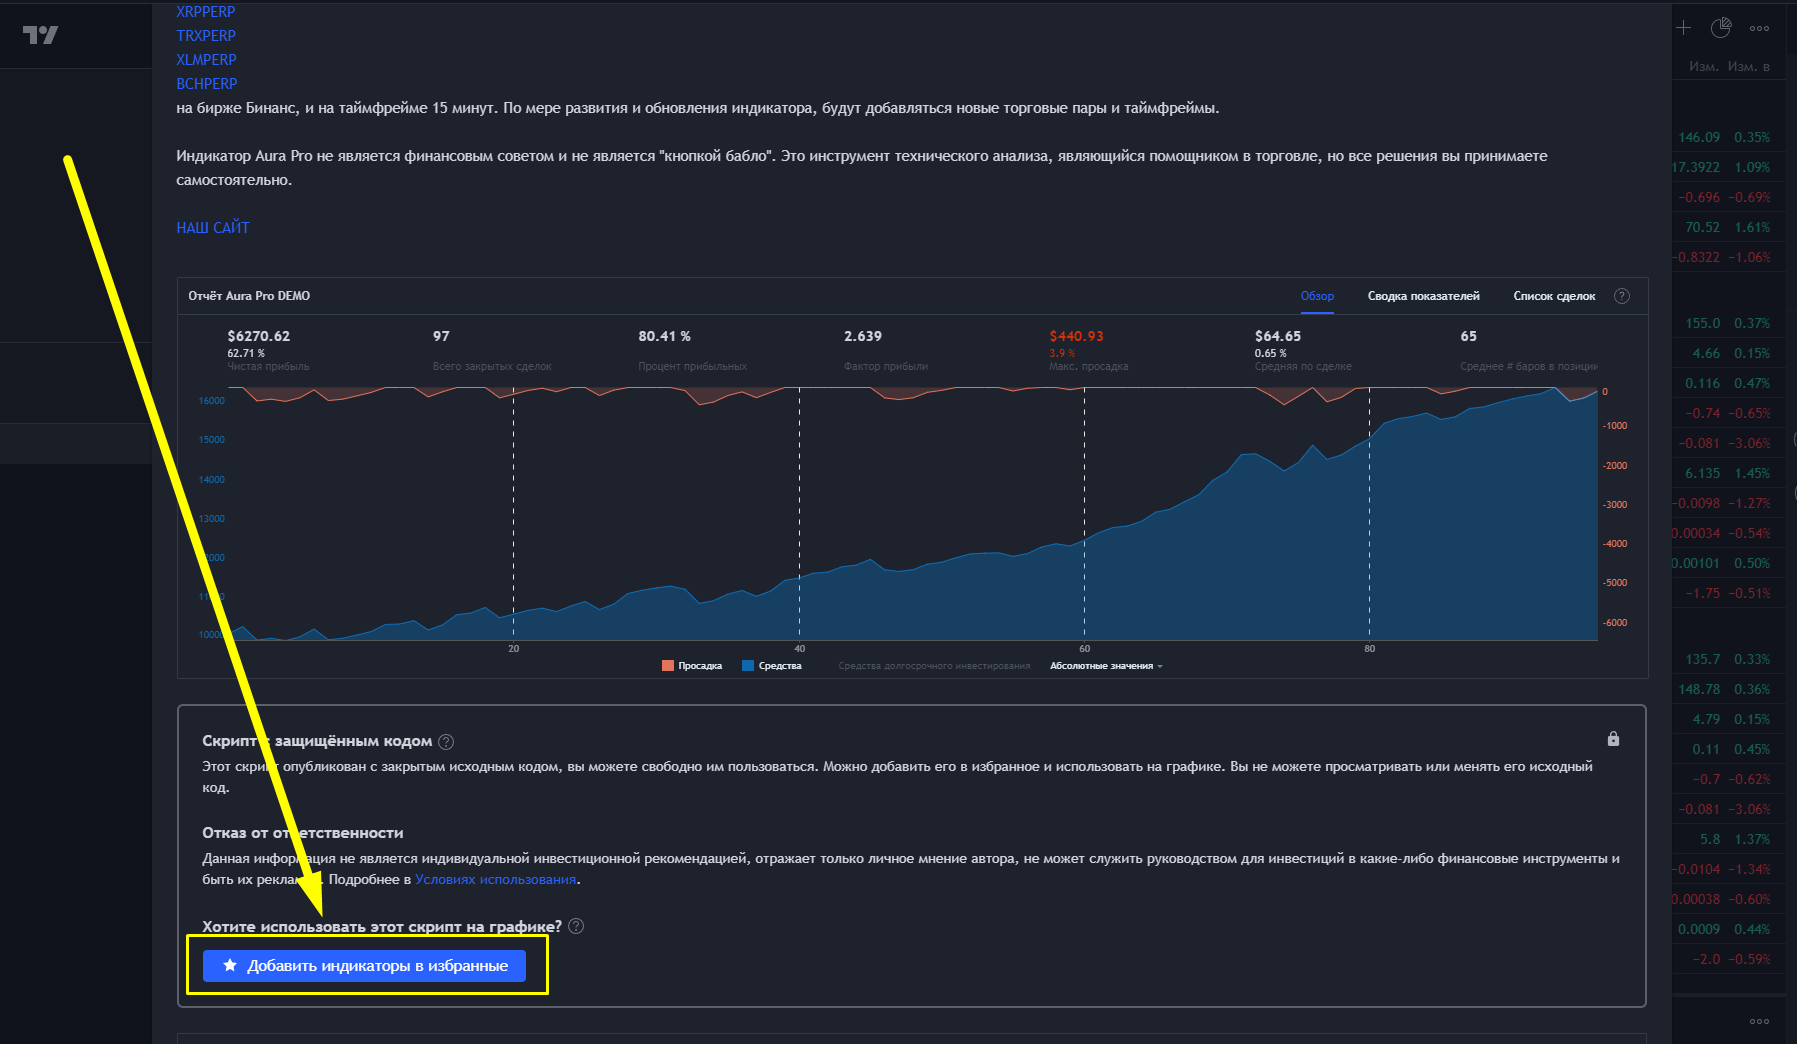
Scroll down the page and add the indicator to your favorites.
Step 3
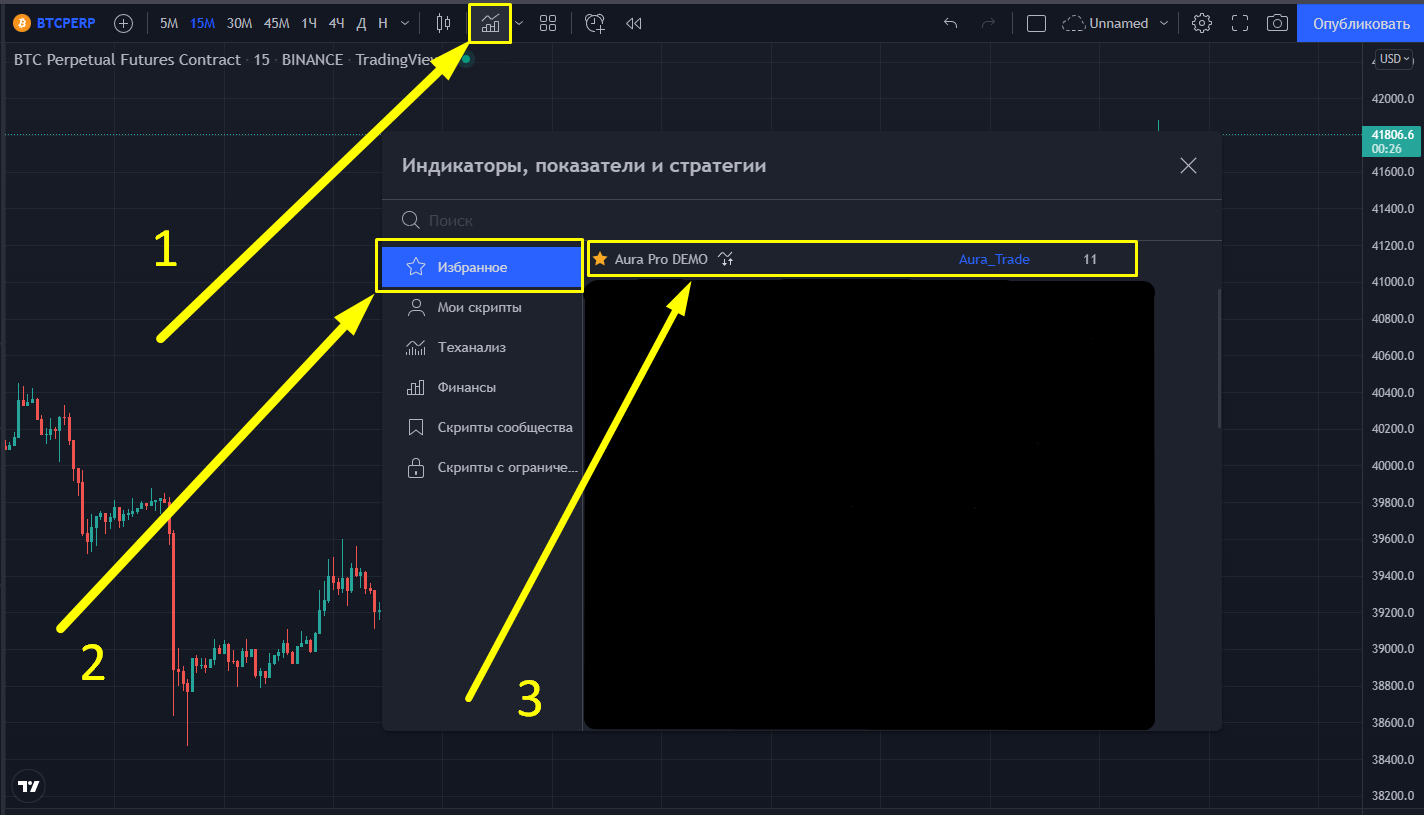
Step 4
Go to the chart, open the "Indicators" section -> "Favorites" tab -> and select the added indicator, after which it will appear on the chart
If the indicator is not displayed in the favorites - wait a bit and repeat step
1
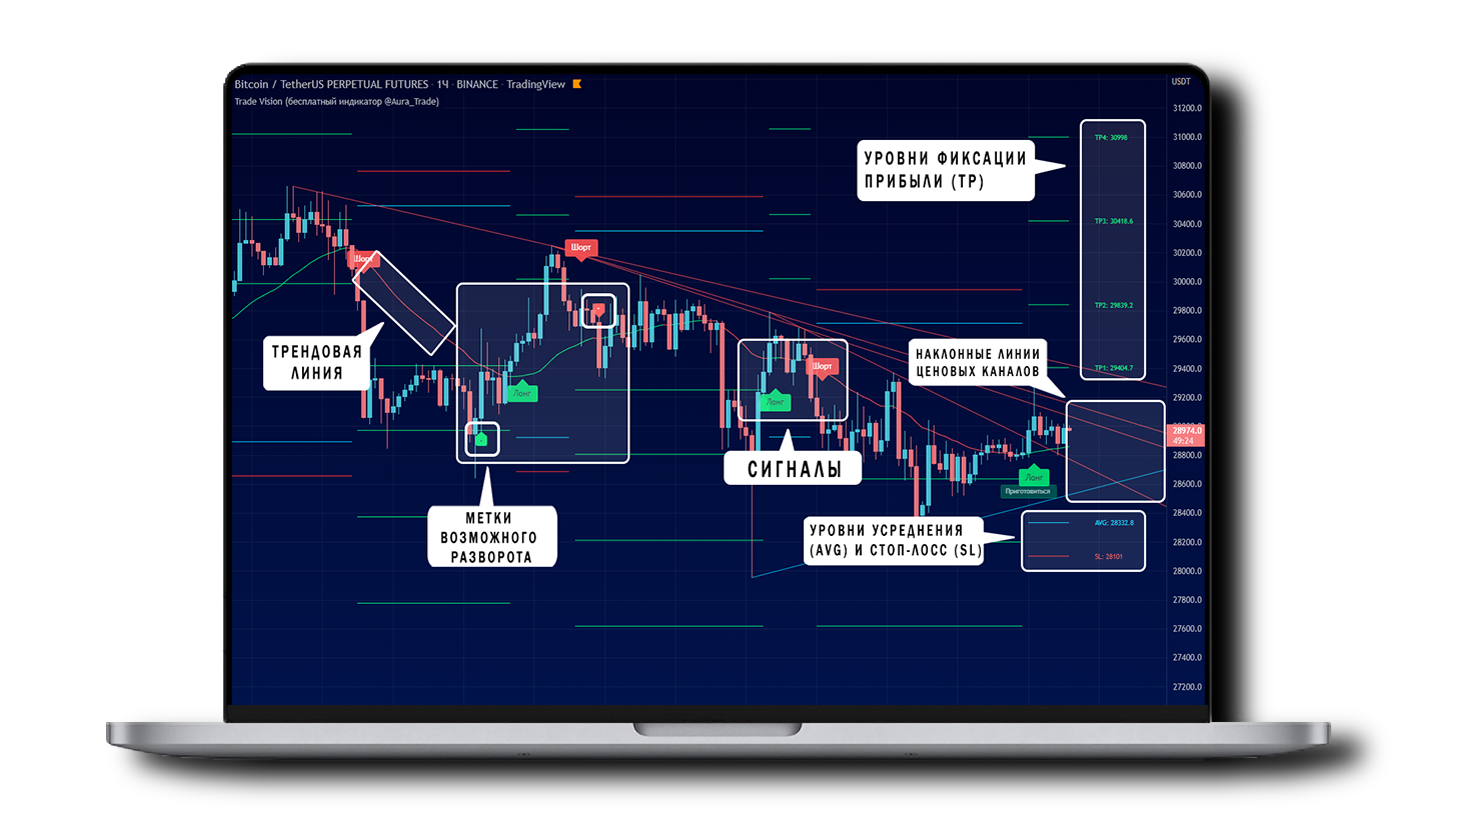
Trade Vision Indicator
Trade Vision is a technical analysis software tool developed by the Aura Trade team, designed to indicate the possible direction of the asset price and help in trading
Indicator capabilities:
Algorithm analyzes asset movements 24/7 and alerts you to potential trades by indicating signal tags to open a Long or Short (buy or sell) position.
The indicator is a universal tool for trading any assets on any markets: cryptocurrency, currency markets, stock markets, indices....
Some "honest" and "correct" projects sell such indicators for 150$ and more, we give for 0$!!!!
The indicator is suitable for both beginners and experienced traders. It works on the popular analytical platform Trading View
Some "honest" and "correct" projects sell such indicators for 150$ and more, we give for 0$!!!!
The indicator is suitable for both beginners and experienced traders. It works on the popular analytical platform Trading View
2
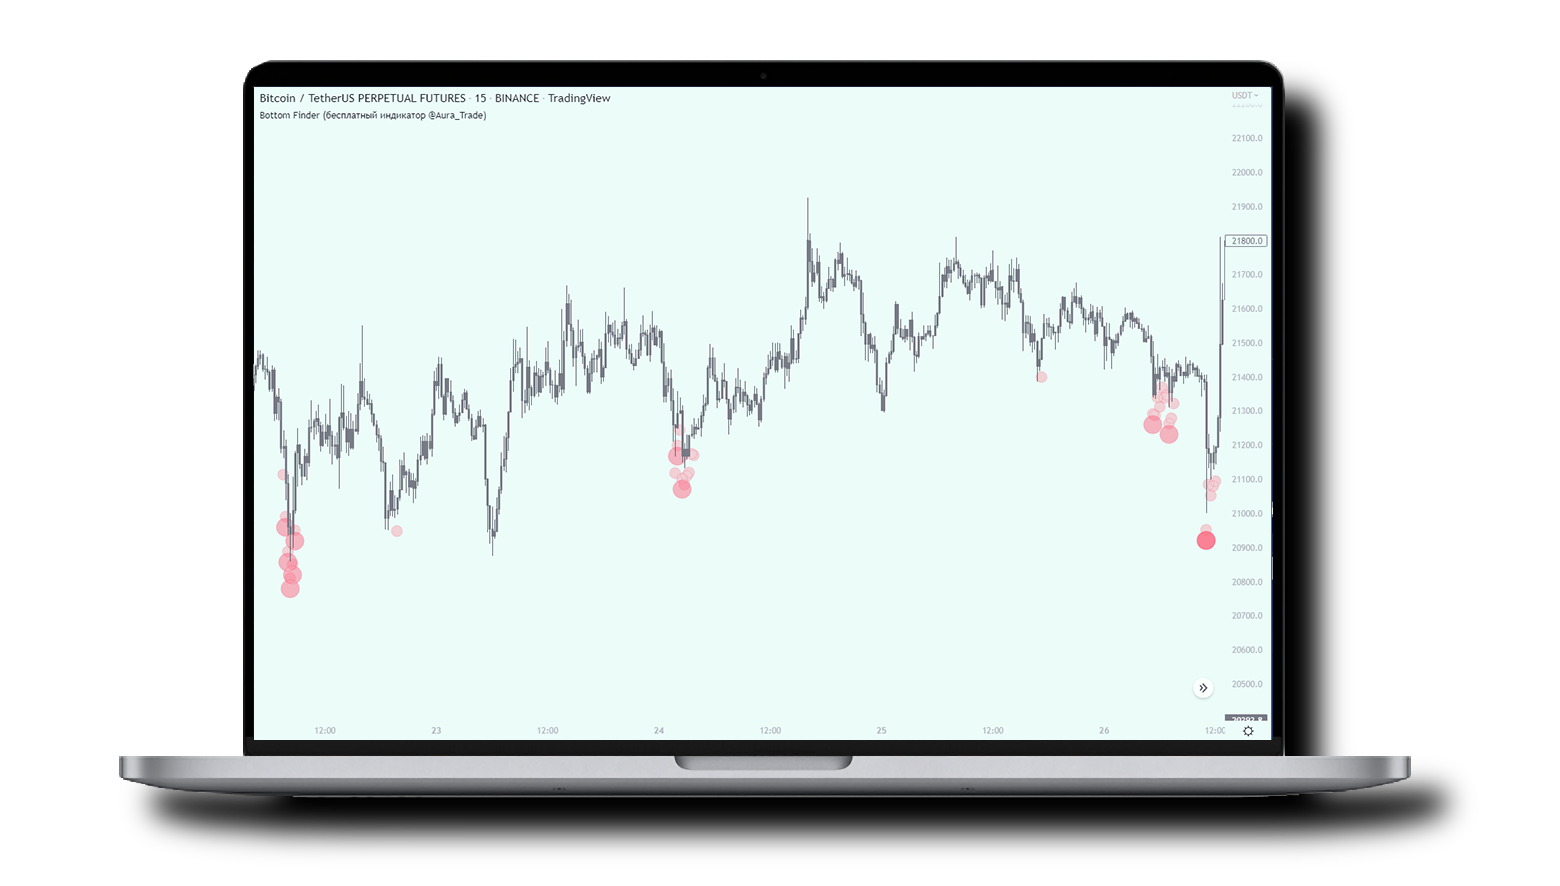
Bottom Finder
The indicator displays when the price is at a local or global bottom
Bottom Finder is an indicator that gives signals when the price is at a local or global bottom. It determines the bottom in 80+% of cases. The bigger and more opaque the circle is - the more likely the price is at the bottom! You can also put alerts. Works on any coins and timeframes
Bottom Finder is an indicator that gives signals when the price is at a local or global bottom. It determines the bottom in 80+% of cases. The bigger and more opaque the circle is - the more likely the price is at the bottom! You can also put alerts. Works on any coins and timeframes
3
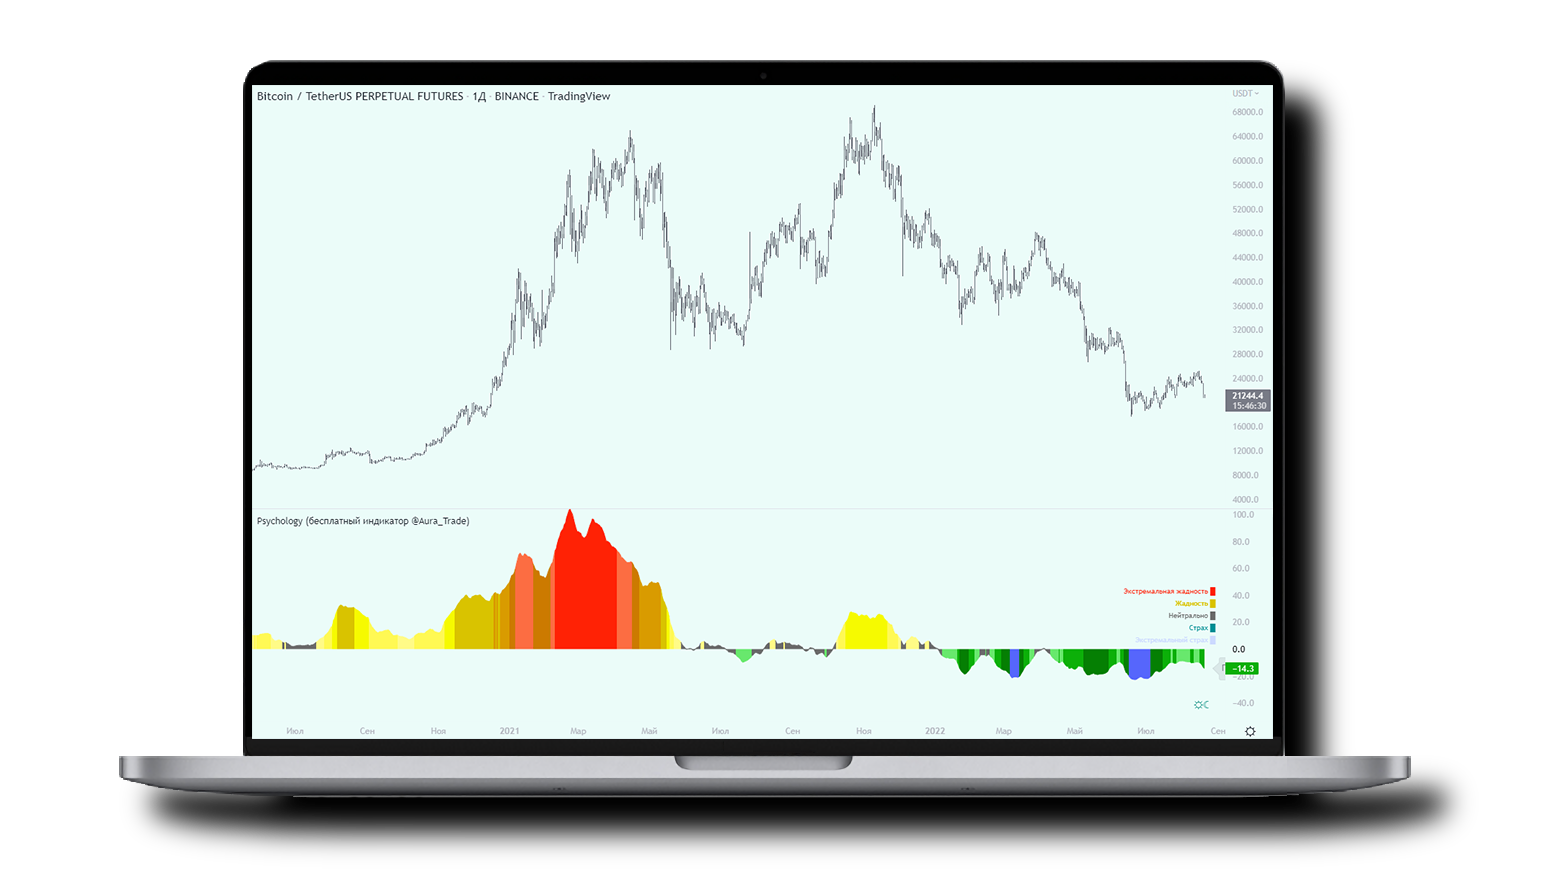
Psychology
Displays the psychological state of the market
Market Cycle Psychology - Where are we in the cycle?
Before we get to the "where" question, let's first briefly consider the question "What is market psychology?".
Market psychology is the idea that market movements reflect the emotional state of market participants. It is one of the main themes of behavioral economics, an interdisciplinary field that studies the various factors that precede economic decisions. Many believe that emotions are the primary driver of change in financial markets and that general fluctuations in investor sentiment are what create so-called psychological market cycles, which are also dynamic.
Stages of investor emotion:
⚫️ Optimism - a positive outlook inspires us for the future, encouraging us to buy stocks.
⚫️ Excitement - After seeing that some of our initial ideas are working, we begin to consider what our success in the market might allow us to accomplish.
⚫️ Thrill - At this point, we investors can't believe our success and start commenting on how smart we are.
⚫️ Euphoria is the point of maximum financial risk. Once we are convinced that every decision leads to quick and easy profits, we begin to ignore risk and expect every trade to be profitable.
⚫️ Anxiety - The first time the market moves against us. Never looking at unrealized losses, we tell ourselves that we are long-term investors and that all of our ideas will eventually work out.
⚫️ Denial - When markets haven't recovered but we don't know how to react, we start to deny either that we made the wrong choices or that things aren't going to get better anytime soon.
⚫️ Fear - market realities become confusing. We believe that the stocks we own will never change in our favor.
⚫️ Desperation - not knowing how to proceed, we grasp at any idea that will get us back to breakeven.
⚫️ Panic - having exhausted all ideas, we don't know what to do next.
⚫️ Capitulation - Having decided that our portfolio will never grow again, we sell all of our stocks to avoid any future losses.
⚫️ Dejection - After leaving the markets, we never want to buy stocks again. This often marks the moment of greatest financial opportunity.
⚫️ Depression - Not realizing how we could have been so stupid, we are left trying to understand our actions.
⚫️ Hope - Eventually we come back to the realization that markets move in cycles and start looking for the next opportunity.
⚫️ Relief - By buying stocks that turn out to be profitable, we regain our faith that investing has a future.
It is difficult to predict with certainty exactly where we are in the market cycle, we can only make an educated guess as to the approximate stage based on the available data. And here is the Trading Psychology - Fear and Greed Index indicator.
Conclusion:
As investors, we always get bogged down in daily price movements and lose sight of the big picture. The biggest crashes do not happen when investors are cautious and fearful, but when they are euphoric and expect financial instruments to continue to rise. So as you continue to invest, remember to stop and ask yourself: where on the chart do you think we are now? The market psychology cycle sheds light on how emotions evolve, the fear and greed index can be useful provided it is not the only tool used to make investment decisions. It's easy to look back over market cycles and realize how general psychology has changed. Analyzing past data makes it obvious which actions and decisions would have been most beneficial. However, it is much harder to understand how the market changes as it evolves, and even harder to predict what will happen next. Many investors use technical analysis to try to anticipate where the market is likely to go. Investors are advised to watch out for fear of potential buying opportunities on dips and view periods of greed as a potential indicator that financial instruments may be overvalued.
4
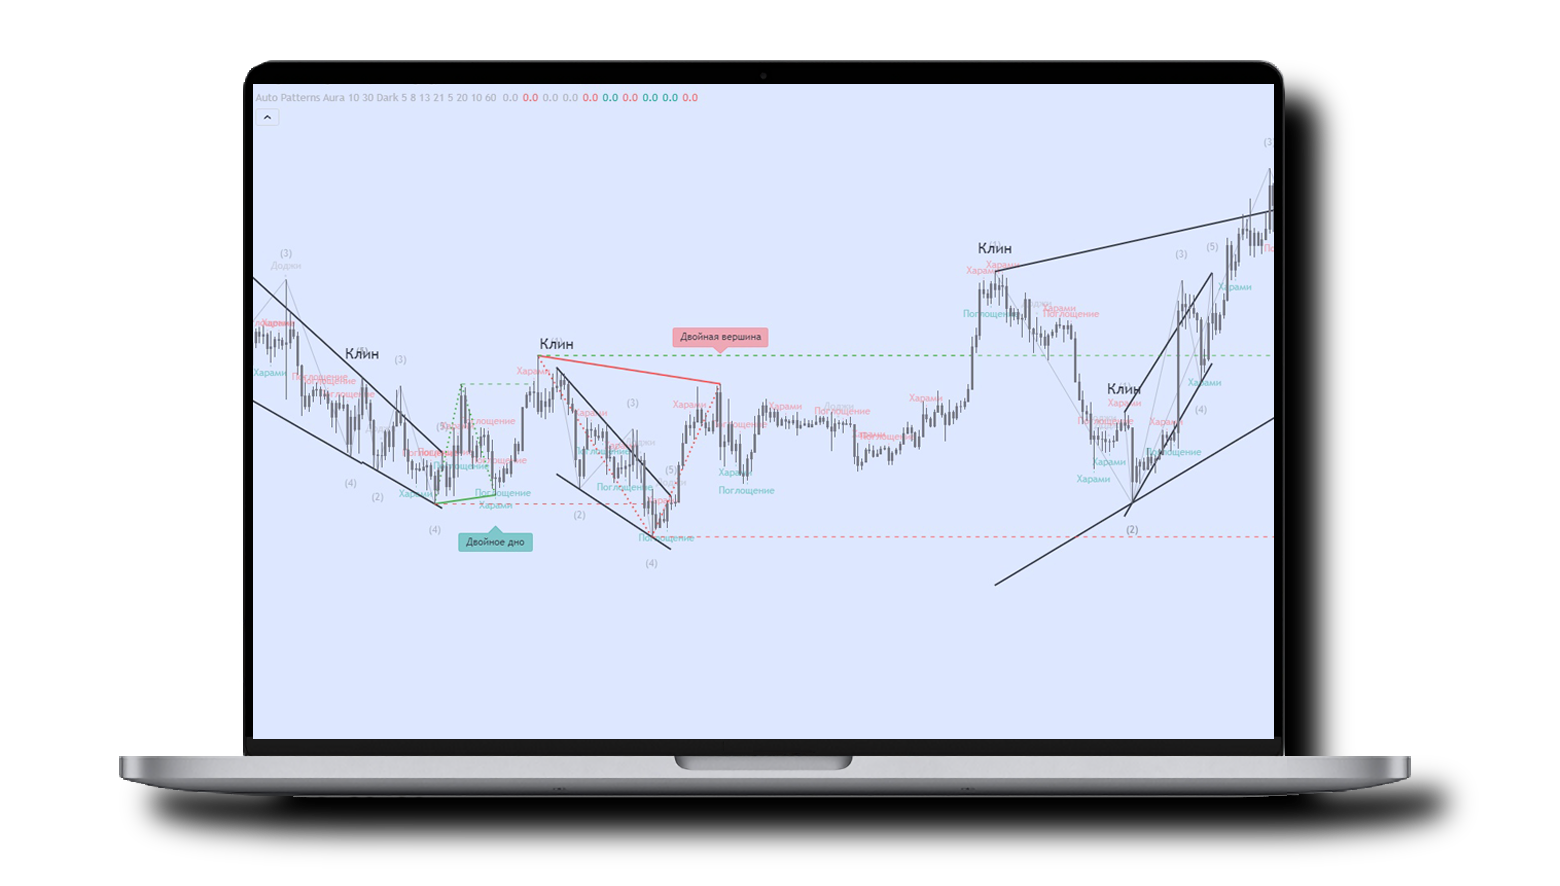
Auto Patterns
Auto Patterns is an interactive indicator that displays chart and candlestick patterns.
The unique feature of the indicator is that when you put the cursor over the pattern name, the explanation of the pattern is displayed. The indicator also provides additional functionality in the form of displaying support and resistance zones (green and red areas) and the ability to select the theme (light and dark) in the indicator settings (gear icon near the name) for convenient use and pleasant display on both light and dark charts.
The unique feature of the indicator is that when you put the cursor over the pattern name, the explanation of the pattern is displayed. The indicator also provides additional functionality in the form of displaying support and resistance zones (green and red areas) and the ability to select the theme (light and dark) in the indicator settings (gear icon near the name) for convenient use and pleasant display on both light and dark charts.
5
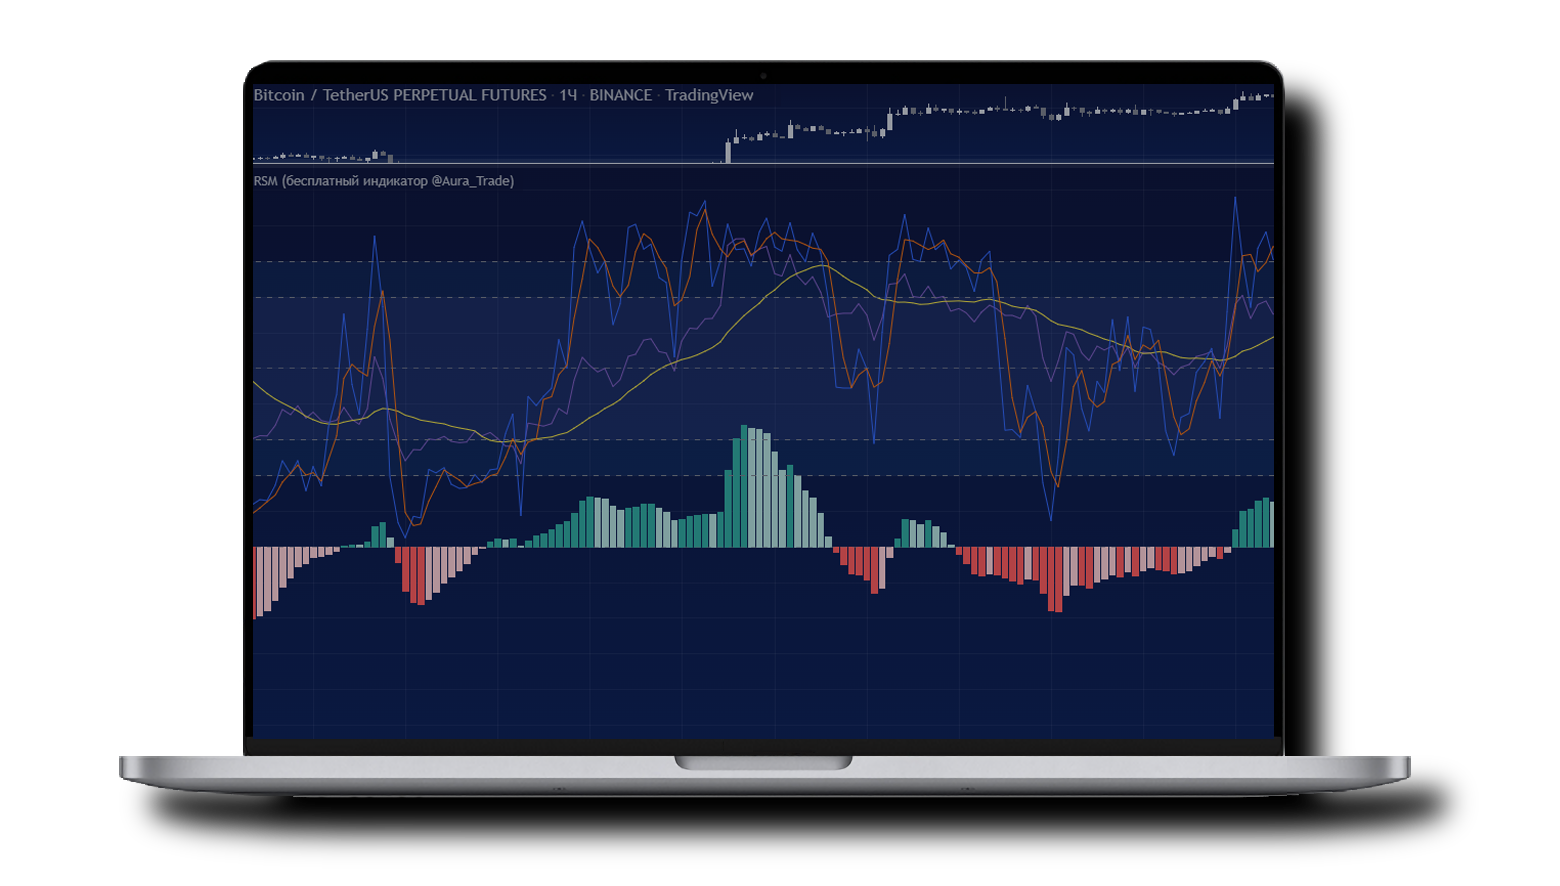
RSM
This script combines 3 well-known oscillator indicators such as RSI , Stochastic and MACD.
RSM is designed to save the number of available indicator slots open on the chart (maximum 3 without a paid subscription to Tradinview). Indicators can be enabled both separately and together, and each can be individually customized, from basic input parameters to color design.
Indicator settings can be opened by placing the mouse cursor over the RSM name in the upper left corner of the indicator field and clicking on the gear icon.
Indicator settings can be opened by placing the mouse cursor over the RSM name in the upper left corner of the indicator field and clicking on the gear icon.
6
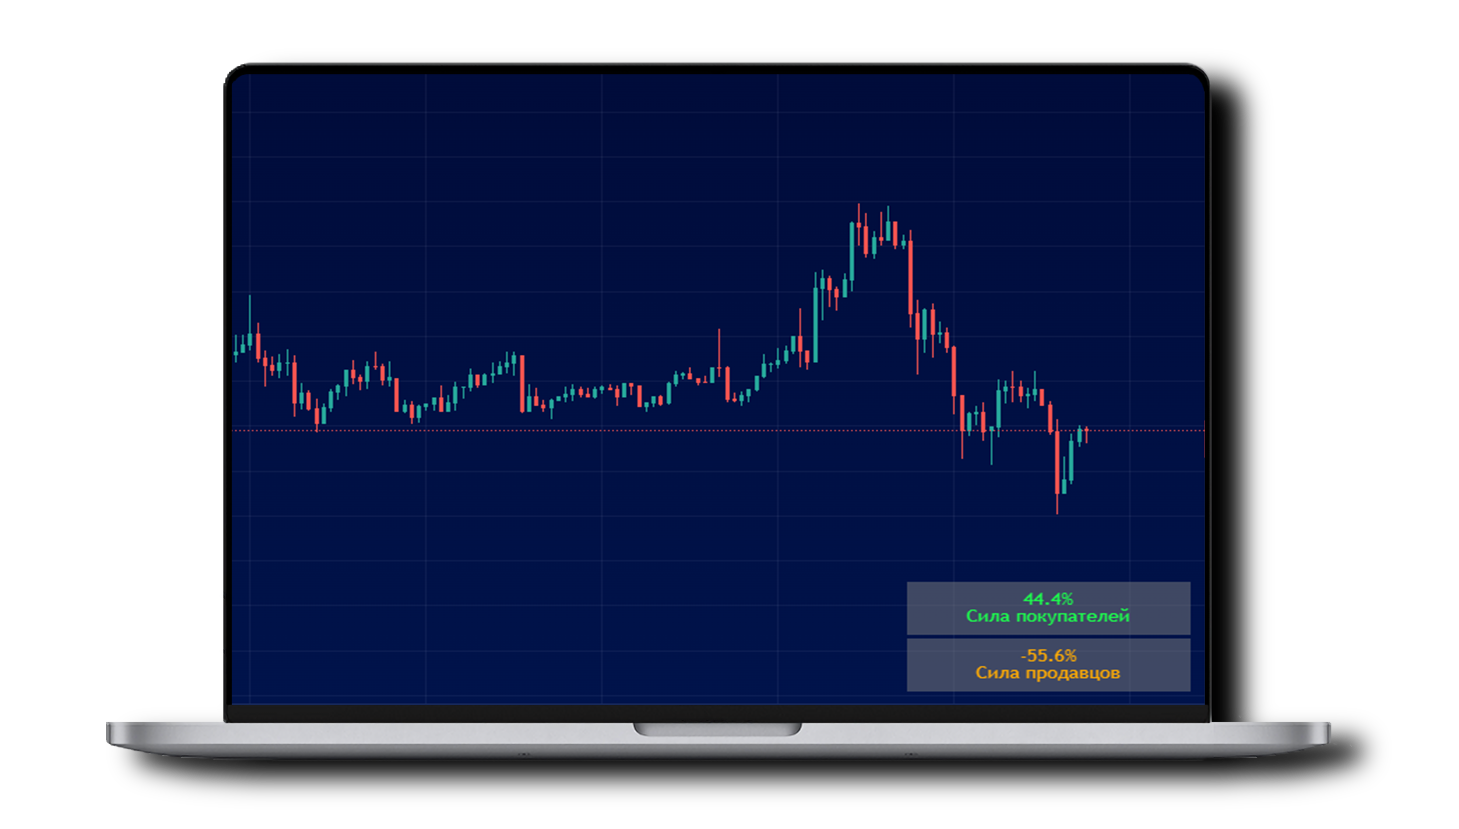
Buyer Seller
Indicator that displays the strength of buyers and sellers at the moment, relative to the selected Timeframe. Works on intraday TFs.

7
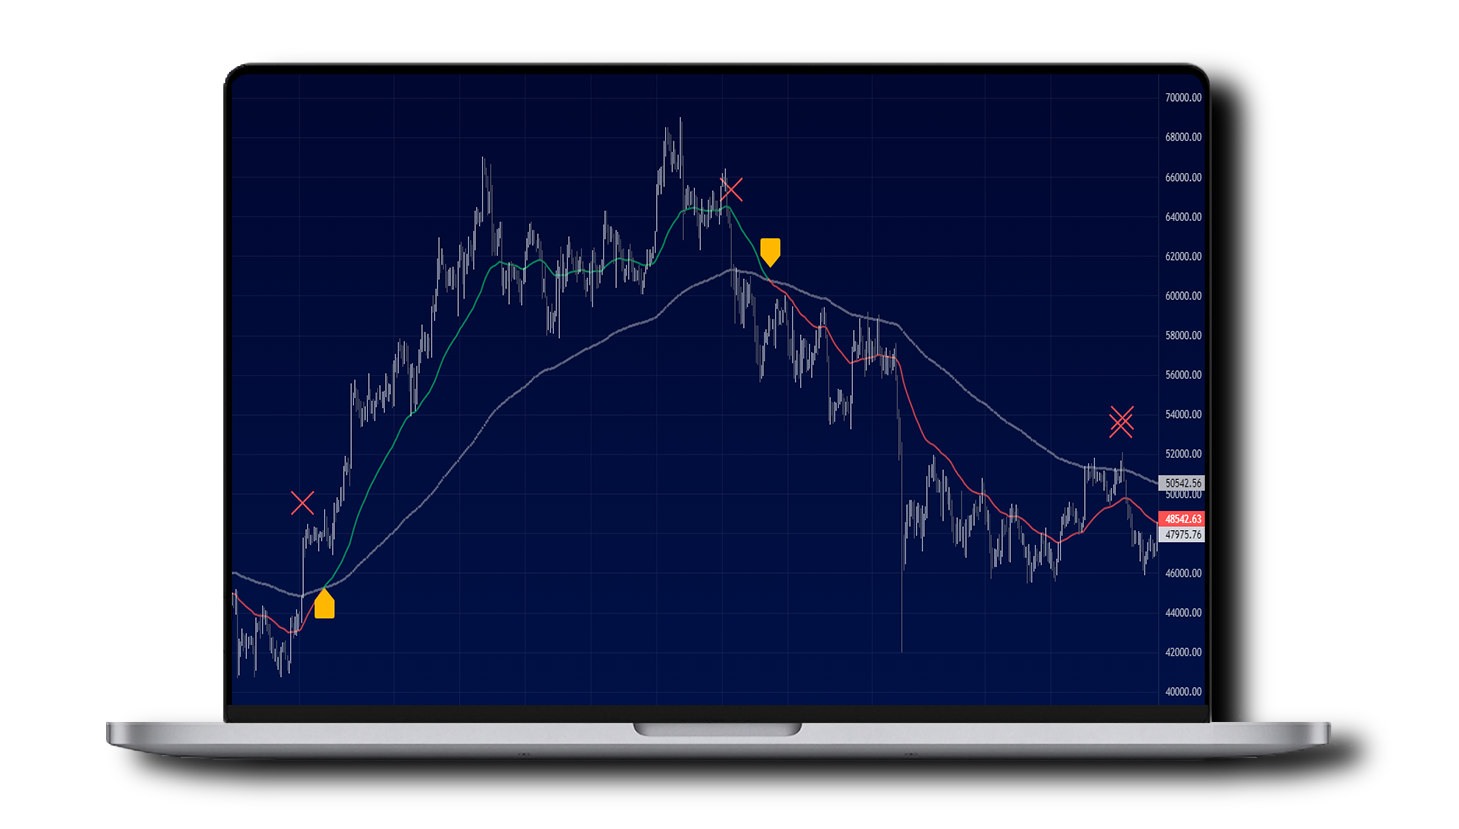
Golden Cross
An indicator showing the crossovers of two moving averages: 50 EMA (colored line) and 200 EMA (gray line), the crossovers are marked with orange arrows.
Up arrow - the colored line crosses the gray line from bottom to top, bullish signal
Down arrow - colored line crosses gray line from top to bottom, bearish signal
Red cross - price crosses 200 EMA - probability of reversal.
The indicator works on any pairs and timeframes.
Down arrow - colored line crosses gray line from top to bottom, bearish signal
Red cross - price crosses 200 EMA - probability of reversal.
The indicator works on any pairs and timeframes.
8
BullsBears
An indicator that helps to determine the potential future direction of price. It analyzes the volumes of purchases and sales, compares the dynamics of volume changes and price dynamics and automatically looks for divergences (discrepancies) between these indicators.
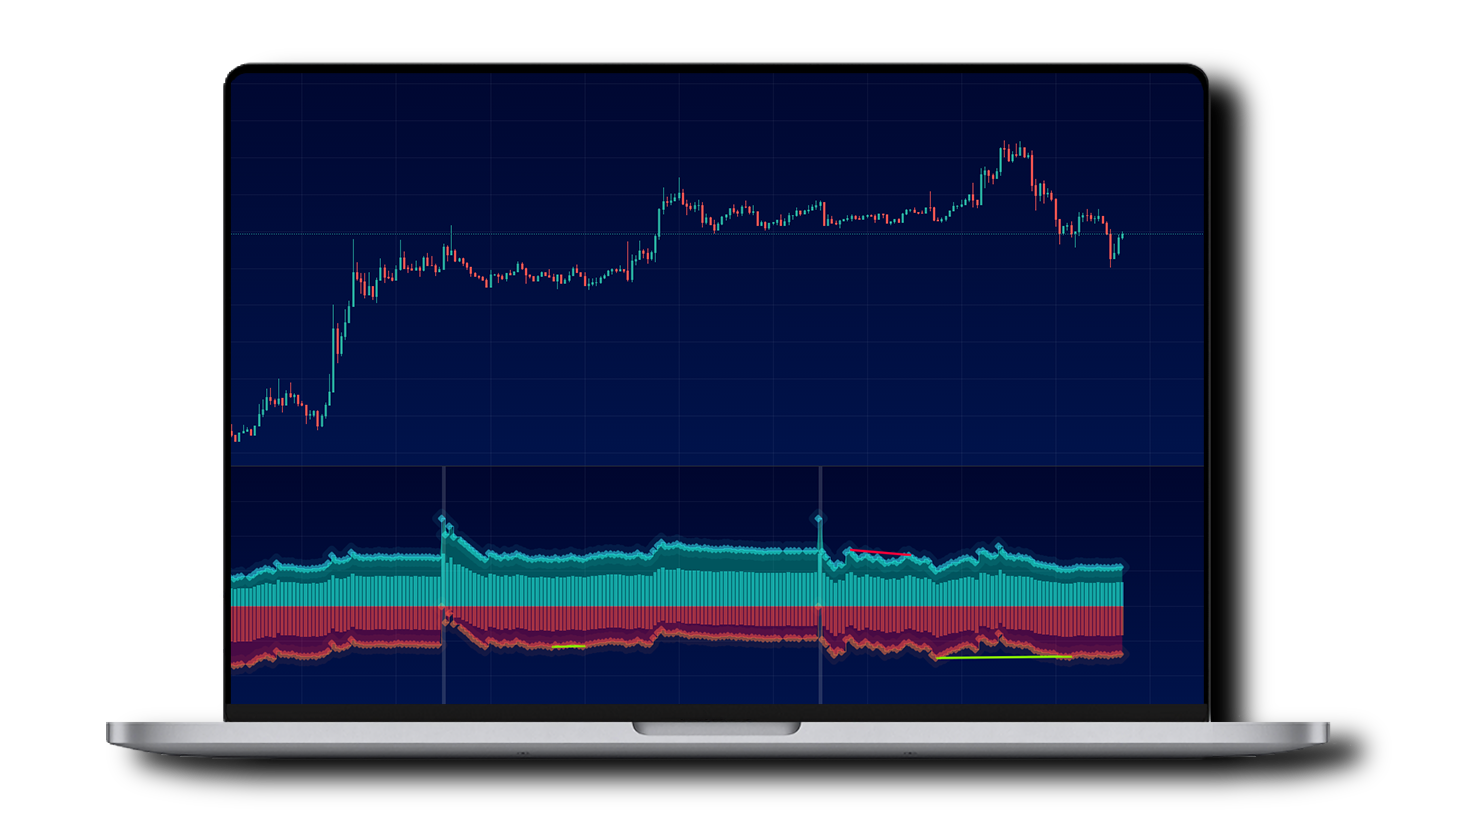
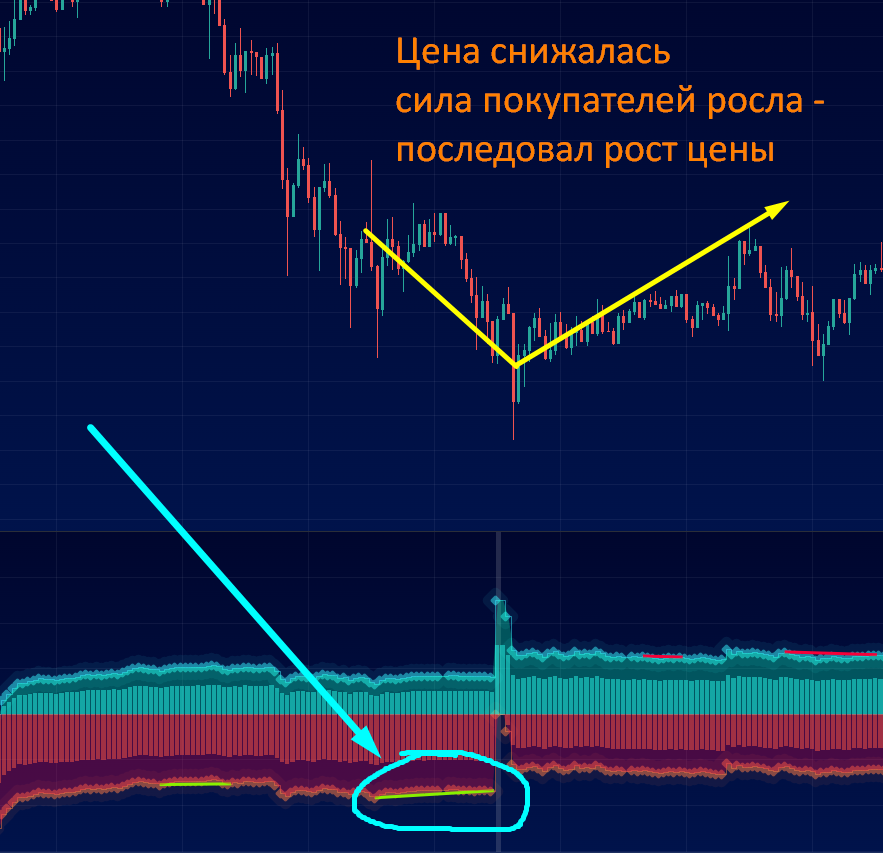
Divergences (for example, the price is rising, but the strength of buyers is decreasing) are potential signals for a trend reversal in a certain direction (bullish divergence - upward reversal, bearish - downward reversal). The indicator marks them with green and red lines respectively.
An example of a bearish divergence:

An example of a bullish divergence:
The indicator also searches for hidden divergences, you can learn more by opening the indicator settings menu and hovering the cursor over the corresponding symbol:
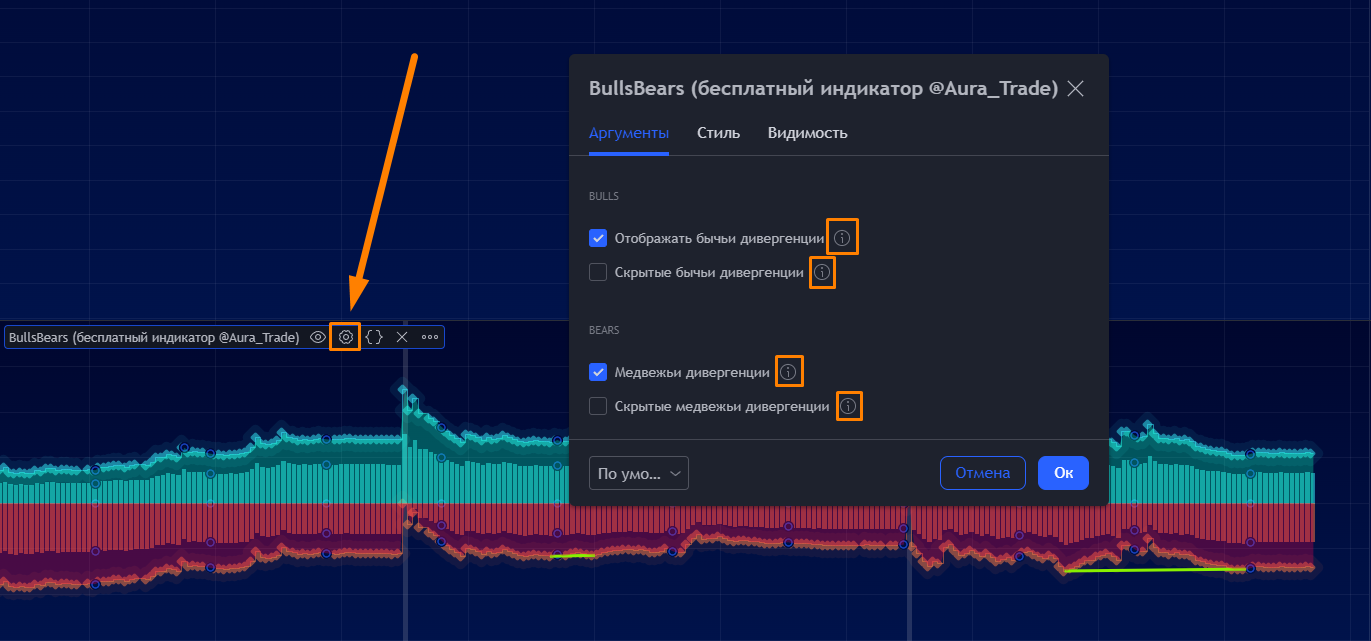
The indicator is applicable on any trading pairs (with available volume data) and timeframes. It works best on TF 5m and 15m
They are excellent aids in the versatile analysis of an asset
To simplify analysis and decision making in manual trading
Own confident understanding of the market, ability to use TradingView services
These indicators will only supplement your trading strategy, you can not rely on their work completely, for this there are our trading strategies and copy trading
A free account will allow you to add only 3 indicators to the chart at a time, but a competent selection of indicators will level this limitation
!
Disclamer
Aura Trade indicators are not financial advice and are not a "dough button". They are tools of technical analysis, which are assistants in trading, but you make all decisions on your own!
PRIVATE ALGORITHMS
Copy-trading
Soon


Copyright © 2021 Aura Trade
FREE TOOLS